The Bull Trap That Set the Stage
Last week’s price action delivered a harsh lesson to late buyers as NQ futures formed a classic bull trap pattern near the highs. What looked like continuation turned into a sharp correction that caught many traders off guard. The selling was aggressive and purposeful, pushing price down through multiple support levels as stops triggered and margin calls forced liquidation.
But here’s where it gets interesting - the correction found a floor exactly where it needed to at the 22,800 level. This wasn’t just any random support; it represented a key institutional buying zone from previous accumulation phases.
Sunday Night Support: The First Sign of Strength
The reversal began during Sunday’s overnight session when price tested 22,800 and immediately found buyers. What started as tentative buying in thin overnight volume gradually built momentum as Asian and European markets opened. By the time we reached Monday’s pre-market session, it was clear that something significant was developing.
The pre-market action showed all the classic signs of institutional accumulation:
- Higher lows on each micro pullback
- Increasing volume on the bid side
- Rejection of any attempts to retest the lows
- Building pressure against overhead resistance
Monday’s Opening Rip: Confirmation of the V-Recovery
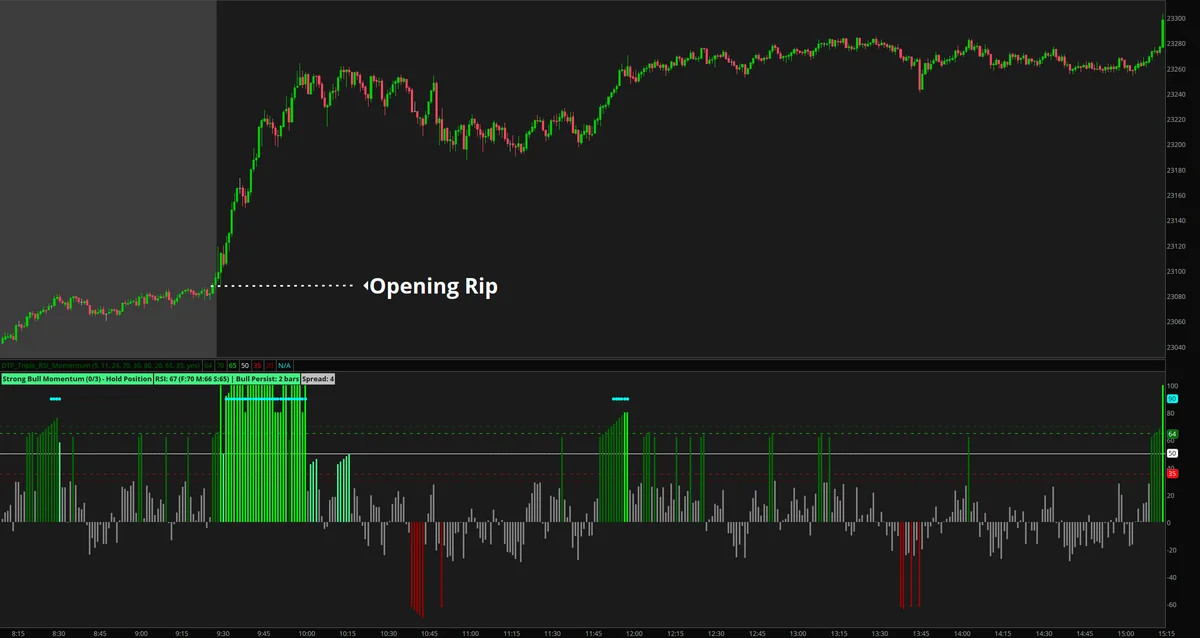
At 9:30 AM ET on Monday, the market delivered one of the cleanest Opening Rip setups we’ve seen this year. Price exploded higher right from the opening bell with several confirming factors:
Opening Rip Characteristics:
- Immediate surge: Price jumped 40+ points in the first 5 minutes
- Volume explosion: Opening volume hit 3x the average
- No hesitation: Clean, directional movement without choppy action
- Breadth confirmation: Advancing issues dominated from the start
- Momentum indicators: Strong Bull Momentum readings on our indicators
The Opening Rip setup from our trading playbook played out perfectly, with price never looking back after the initial thrust higher. This wasn’t just a bounce - it was a statement by the bulls that the correction was over.
Understanding V-Shaped Recovery Patterns
V-shaped recoveries are among the most powerful reversal patterns in technical analysis. They represent a complete sentiment shift from bearish to bullish in a compressed timeframe. Here’s what makes them so significant:
Key Characteristics of V-Recoveries:
- Sharp decline: A significant correction that creates fear and capitulation
- Clear support: A decisive bottom at a meaningful technical level
- Rapid reversal: Quick rejection of lows with increasing buying pressure
- Volume confirmation: Heavy volume on both the decline and recovery
- Momentum shift: Complete change in market character from bearish to bullish
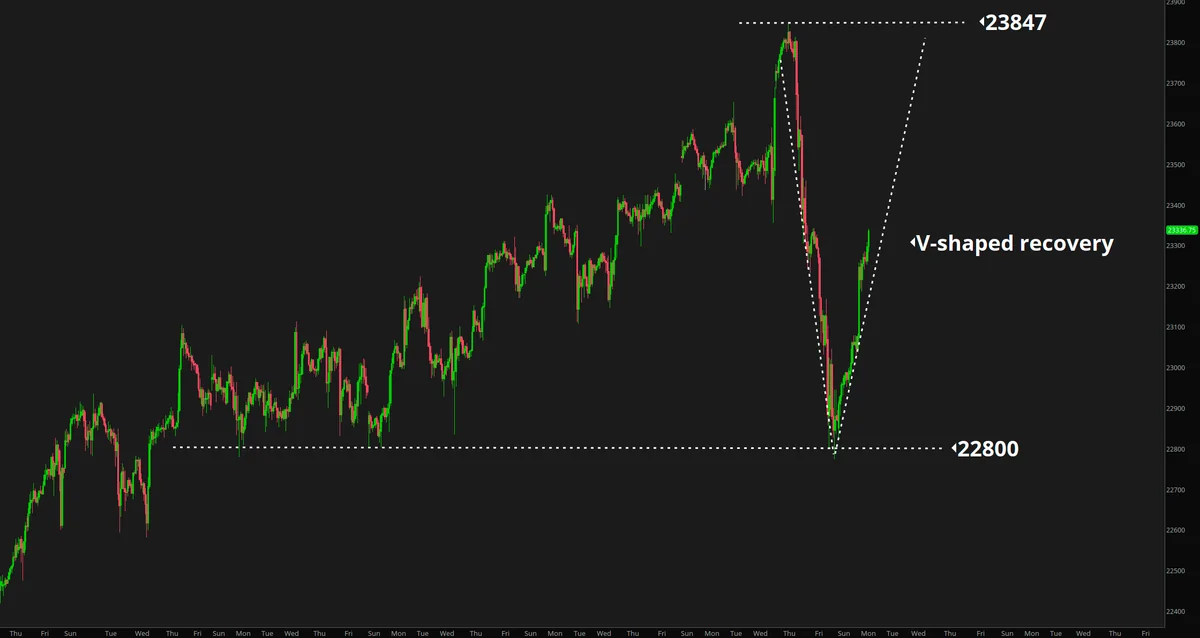
What we’re seeing in NQ checks all these boxes perfectly. The correction from the bull trap was sharp enough to reset sentiment, the 22,800 support held firmly, and the reversal has been explosive with strong volume backing it up.
The Critical Test: All-Time High at 23,847
Now comes the moment of truth. The V-shaped recovery has brought us right back to the prior all-time high at 23,847. This level represents more than just a number - it’s a psychological battlefield where bulls and bears will duke it out for control of the longer-term trend.
Why 23,847 Matters:
- Previous rejection point: Where last week’s bull trap formed
- Psychological resistance: Round number just below 24,000
- Institutional decision point: Major funds will position here
- Breakout potential: Clear skies above if we can push through
The next few sessions will be crucial. If NQ can break and hold above 23,847, we’re likely looking at an acceleration higher with initial targets at 24,000 and then 24,250. The measured move from the V-shaped pattern projects even higher, potentially reaching 24,500-24,600 by mid-August.
Trading the V-Recovery Setup
For traders looking to participate in this powerful pattern, here are the key levels and strategies to consider:
Support Levels to Watch:
- 23,500: First support on any pullback (previous resistance)
- 23,200: Stronger support at the midpoint of today’s range
- 22,800: Ultimate support that must hold for bulls to maintain control
Resistance and Targets:
- 23,847: Immediate resistance at all-time high
- 24,000: Psychological round number resistance
- 24,250: Measured move target from the V-bottom
- 24,500: Extended target for August
Risk Management:
The beauty of V-shaped recoveries is they provide clear risk parameters. Any break back below 22,800 would invalidate the pattern and suggest the correction has further to go. Until that happens, the bias remains firmly bullish with dips being bought aggressively.
Market Psychology Behind the Recovery
Understanding why V-shaped recoveries are so powerful requires diving into market psychology. Last week’s bull trap created maximum pain for late longs who bought near the highs. The subsequent correction forced these traders out, creating a cleaner technical picture.
When price found support at 22,800, it attracted a different class of buyer - the institutional players who had been waiting for a pullback. Their aggressive buying created the Opening Rip, which then triggered a cascade of effects:
- Short covering: Bears who got greedy had to cover quickly
- FOMO buying: Sidelined money rushed back in
- Technical breakouts: Algorithms triggered buy signals
- Momentum acceleration: Each push higher attracted more buyers
This self-reinforcing cycle is what creates the “V” shape and why these patterns often lead to sustained moves higher.
What to Expect This Week
With the V-shaped recovery now established, here’s what traders should watch for in the coming sessions:
Bull Case Scenario:
- Break above 23,847 with volume
- Hold above that level on any retest
- Continuation higher toward 24,000+
- New all-time highs throughout August
Bear Case Warning Signs:
- Rejection at 23,847 with heavy selling
- Break back below 23,200 support
- Declining momentum on rally attempts
- Return to 22,800 would be very bearish
The probabilities favor the bulls here given the strength of the recovery and the classic pattern formation. V-shaped recoveries have a high success rate when they occur at significant support levels like we’ve seen at 22,800.
Key Takeaways
Today’s action reinforces several important trading principles:
- Major support levels matter: The 22,800 level proved its importance
- Opening Rips signal strength: When the market explodes at open, listen
- V-recoveries are powerful: These patterns often lead to extended moves
- Psychology drives price: The shift from fear to greed happened quickly
- Respect the trend: Until 22,800 breaks, bulls have control
Looking Ahead
The stage is set for an exciting week in NQ futures. We have a textbook V-shaped recovery pattern, strong momentum from an Opening Rip setup, and we’re knocking on the door of all-time highs. If 23,847 gives way, August could deliver the kind of trending move that traders dream about.
Stay nimble, respect your stops, and remember that V-shaped recoveries often move faster and further than anyone expects. The combination of trapped shorts, sidelined buyers, and momentum algorithms could create a perfect storm for higher prices.
The next 24-48 hours will likely determine whether this V-recovery completes with new all-time highs or if we need more consolidation before the next leg higher. Either way, the 22,800 support level has proven its significance, and as long as it holds, the path of least resistance remains higher.