The Perfect Storm: Earnings Euphoria Meets Reality
August 1st, 2025 marks a pivotal moment for NQ futures, as what began as post-earnings euphoria has transformed into a textbook lesson about bull traps and the importance of key technical levels. After Microsoft and Meta delivered better-than-expected quarterly results, the initial market reaction was exactly what bulls hoped for - a rally to fresh all-time highs that seemed to confirm the ongoing technology leadership.
However, as seasoned traders know all too well, initial reactions to earnings don’t always tell the complete story. What appeared to be sustainable momentum quickly revealed itself as institutional distribution, creating one of the most educative bull trap patterns we’ve seen this year.
The Bull Trap Unfolds
The sequence of events perfectly illustrates how bull traps develop in mature market cycles:
Phase 1: Earnings Euphoria - MSFT and META’s strong results triggered immediate buying, pushing NQ to new all-time highs. Retail sentiment reached extreme bullish levels as traders positioned for continued technology strength.
Phase 2: Institutional Distribution - As prices reached new highs, large institutional players began systematic profit-taking. The selling wasn’t immediately obvious as it was absorbed by continued retail buying interest.
Phase 3: The Trap Springs - Eventually, the selling pressure overwhelmed buying interest, creating the sharp reversal that defines a bull trap. Traders who bought the breakout found themselves trapped above key support levels.
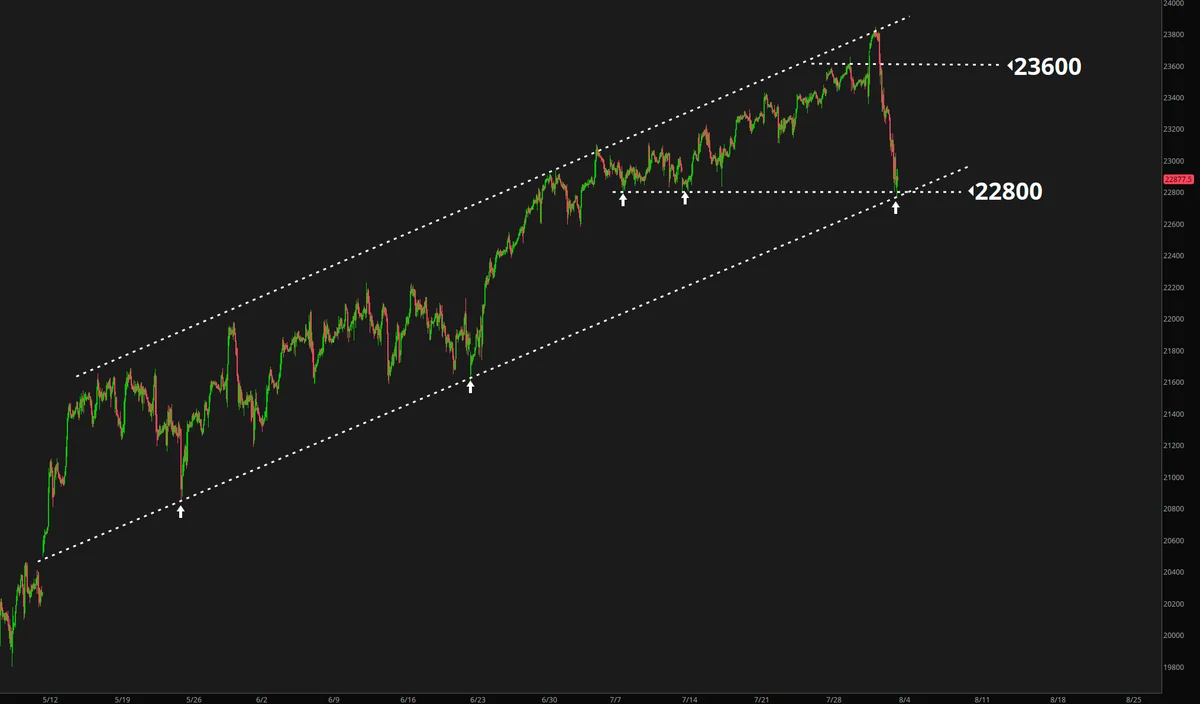
Phase 4: Support Test - The decline continued until reaching the ascending channel’s lower boundary at 22800, where we find ourselves today.
Channel Support: The Critical 22800 Level
The hourly chart reveals the significance of our current position. The ascending channel that has guided NQ’s recent uptrend has its lower support precisely at 22800 - and this is exactly where the selling has stalled.
Why 22800 Matters:
- Channel Geometry: Represents the mathematical lower bound of the ascending trend
- Volume Profile: Significant trading activity at this level during the recent uptrend
- Psychological Level: Round number that attracts institutional attention
- Technical Confluence: Multiple technical indicators converge at this price point
The fact that NQ found support exactly at this level suggests that the ascending channel structure remains intact, at least for now. However, this also means we’re at a critical decision point where the next move will likely determine the market’s direction for the coming weeks.
Monthly Chart: Echoes of 2000
Perhaps the most intriguing aspect of the current setup is what emerges when we examine the monthly chart. The pattern similarity to the 2000 market top is striking and worth serious consideration.
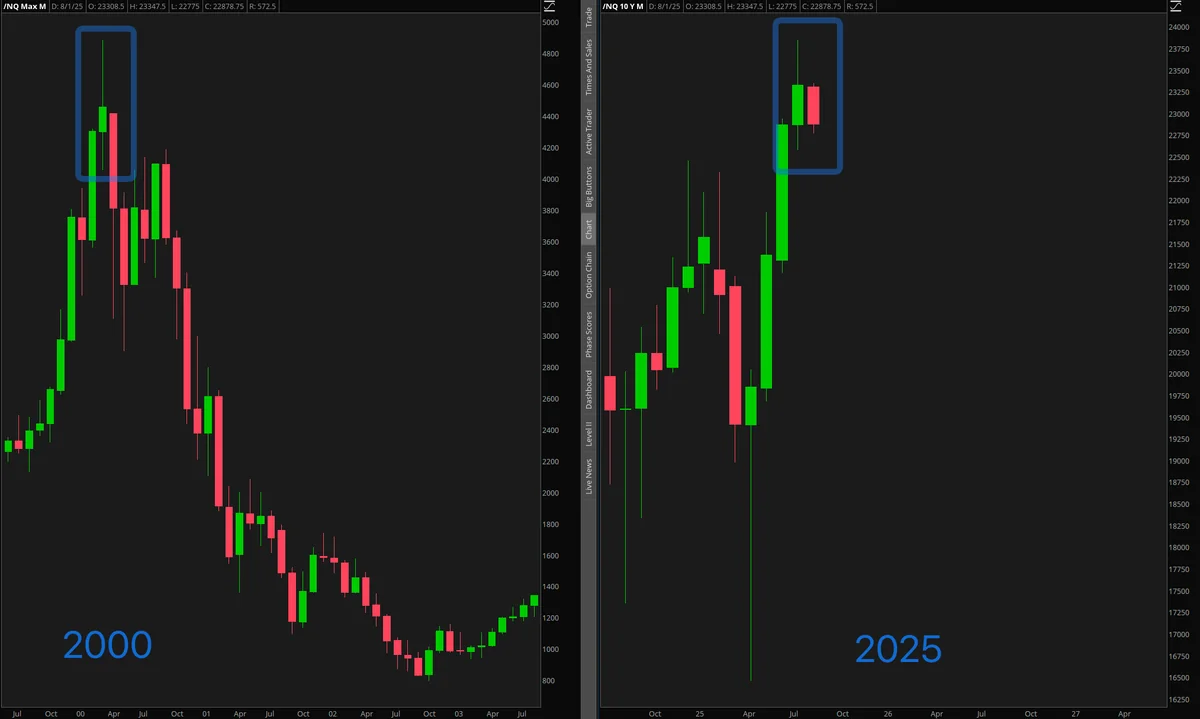
Key Similarities:
- Extended Bull Run: Both periods followed multi-year technology-led advances
- Valuation Extremes: Technology stocks reached stretched valuations in both cycles
- Distribution Pattern: Similar institutional selling patterns at market peaks
- Momentum Divergence: Technical indicators showing weakening momentum despite new highs
Important Differences:
- Economic Environment: Different interest rate and inflation dynamics
- Market Structure: Modern markets have different liquidity characteristics
- Technology Fundamentals: Current tech earnings are generally stronger than 2000
While historical comparisons provide context, they don’t guarantee identical outcomes. However, they do suggest increased caution is warranted at current levels.
Two Scenarios for Next Week
Given the current technical setup and seasonal considerations, two primary scenarios emerge for the coming week:
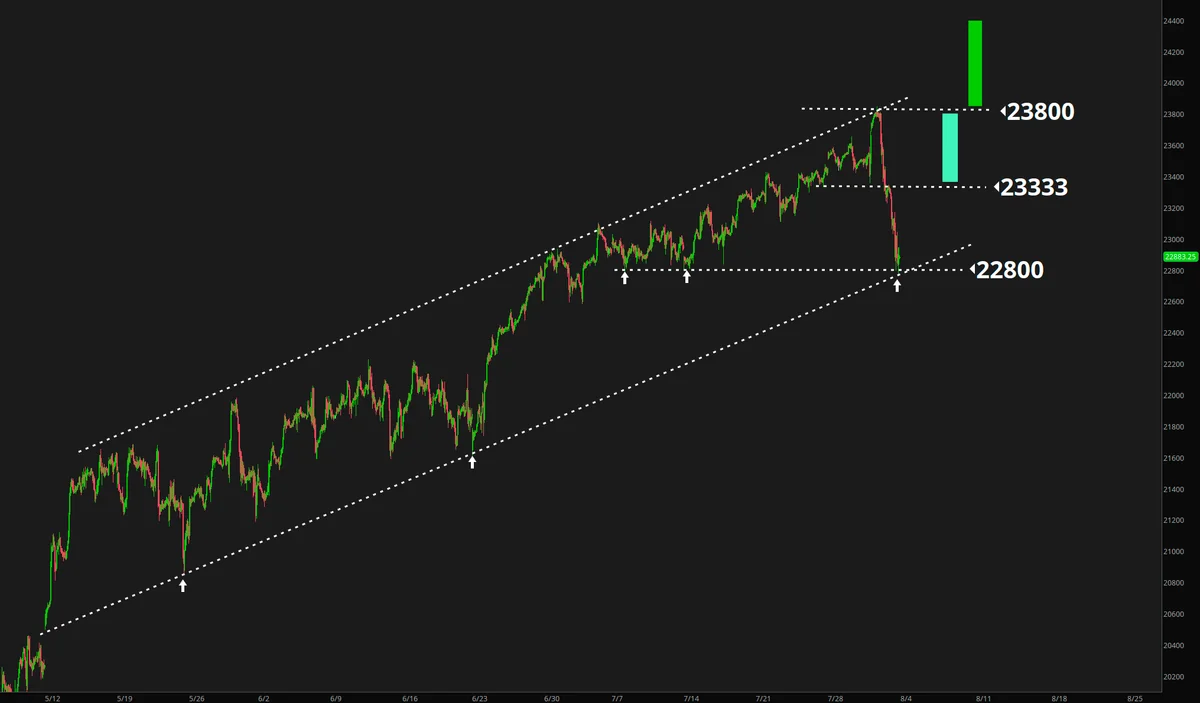
Bullish Scenario: Channel Support Holds
Prerequisites:
- Monday opens with strength (consistent with recent Monday patterns)
- 22800 support level holds on any retests
- Volume expansion on any bounce attempts
Key Levels:
- Immediate Resistance: 23100 (previous support turned resistance)
- Major Resistance: 23333 (critical breakout level)
- Bullish Confirmation: Sustained move above 23333
Probability Assessment: Moderate The ascending channel support is meaningful, and recent Mondays have shown strength. However, August’s historically weak performance and the bull trap pattern create headwinds.
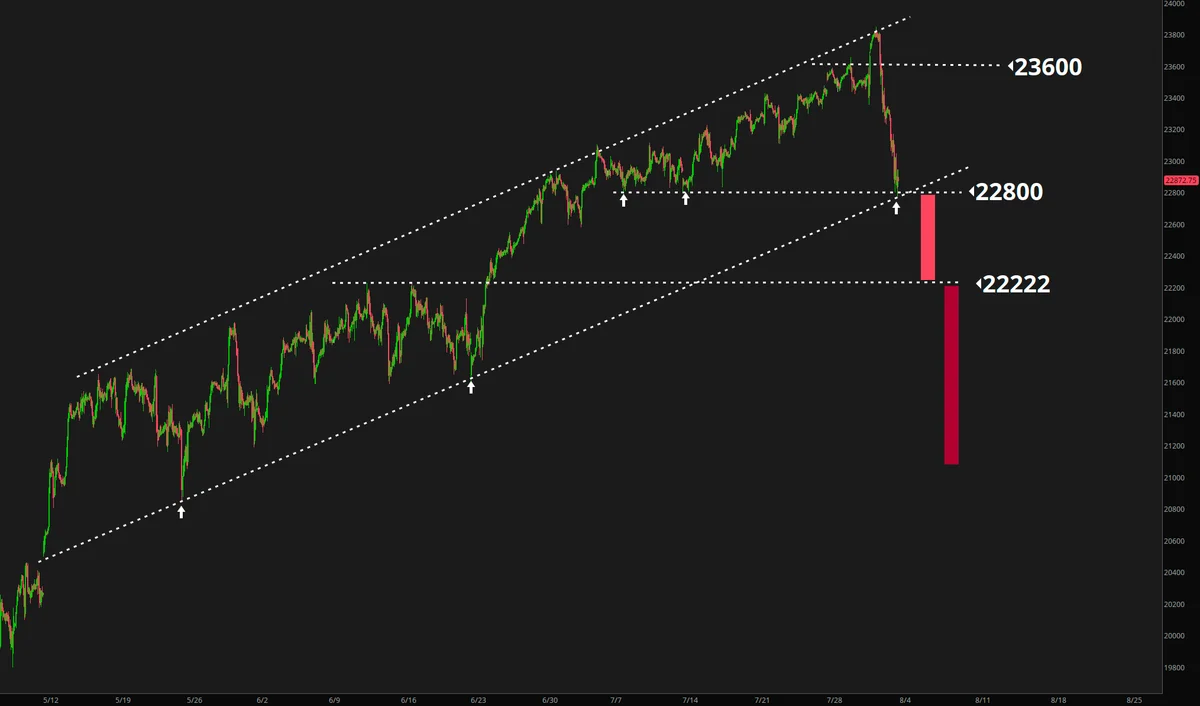
Bearish Scenario: Channel Breakdown
Prerequisites:
- Failure to hold 22800 on a closing basis
- Increasing selling volume on any breakdown
- Broader market weakness confirming the move
Key Levels:
- Initial Target: 22600 (minor support level)
- Major Target: 22222 (significant psychological and technical support)
- Bearish Confirmation: Daily close below 22800
Probability Assessment: Moderate to High August’s historical weakness, combined with the bull trap pattern and monthly chart similarities to 2000, support this scenario.
August Factor: Historical Context
August’s reputation as a challenging trading month adds another layer to consider:
Historical August Patterns:
- Lower Volume: Many institutional traders on vacation
- Increased Volatility: Thinner liquidity can amplify moves
- Seasonal Weakness: Historically one of the weaker months for equity indices
- September Setup: August often sets the tone for September performance
This seasonal context suggests that even if we see initial strength, sustaining momentum could prove challenging throughout the month.
What to Watch: Key Levels and Catalysts
Critical Price Levels:
- 22800: Channel support - must hold for bullish scenario
- 23100: First resistance on any bounce
- 23333: Major resistance - bullish game-changer if exceeded
- 22222: Major support target if channel breaks
Fundamental Catalysts:
- Economic Data: Employment reports and inflation data
- Fed Communication: Any hints about policy direction
- Earnings Season: Additional technology earnings results
- Geopolitical Events: Any market-moving developments
Technical Indicators:
- Volume: Need expansion on any directional moves
- Breadth: Market internals will confirm or diverge from price action
- Volatility: VIX behavior around key price levels
Trading Implications and Risk Management
The current setup demands careful risk management regardless of your directional bias:
For Bulls:
- Wait for confirmation above 23100 before adding positions
- Use 22800 as a stop-loss level with appropriate position sizing
- Consider the monthly chart pattern as a reason for reduced position sizes
For Bears:
- Look for a daily close below 22800 as confirmation
- Initial target at 22222 offers a reasonable risk/reward setup
- Be prepared for potential whipsaws at these key levels
For Range Traders:
- The 22800-23100 range offers tactical opportunities
- Use smaller position sizes given the potential for breakout moves
- Monitor volume carefully for directional clues
Conclusion: A Critical Juncture
August 1st has positioned NQ at one of the most important technical levels we’ve seen this year. The combination of the bull trap from earnings euphoria, the test of ascending channel support, and the historical context of August trading creates a setup that demands attention.
The similarities to the 2000 market top provide cautionary context, while the ascending channel support at 22800 offers hope for continued bullish momentum. The resolution of this setup will likely set the tone not just for August, but potentially for the remainder of 2025.
As we move into next week, the key is to let the market show its hand rather than forcing a directional bias. The levels are clearly defined, the scenarios are mapped out, and now it’s time for price action to provide the answers.
Whether we see a bullish breakout above 23333 or a bearish breakdown below 22800, the current setup offers the kind of clearly defined risk/reward scenarios that successful traders wait for. The market rarely provides such clear technical roadmaps - when it does, it pays to listen.