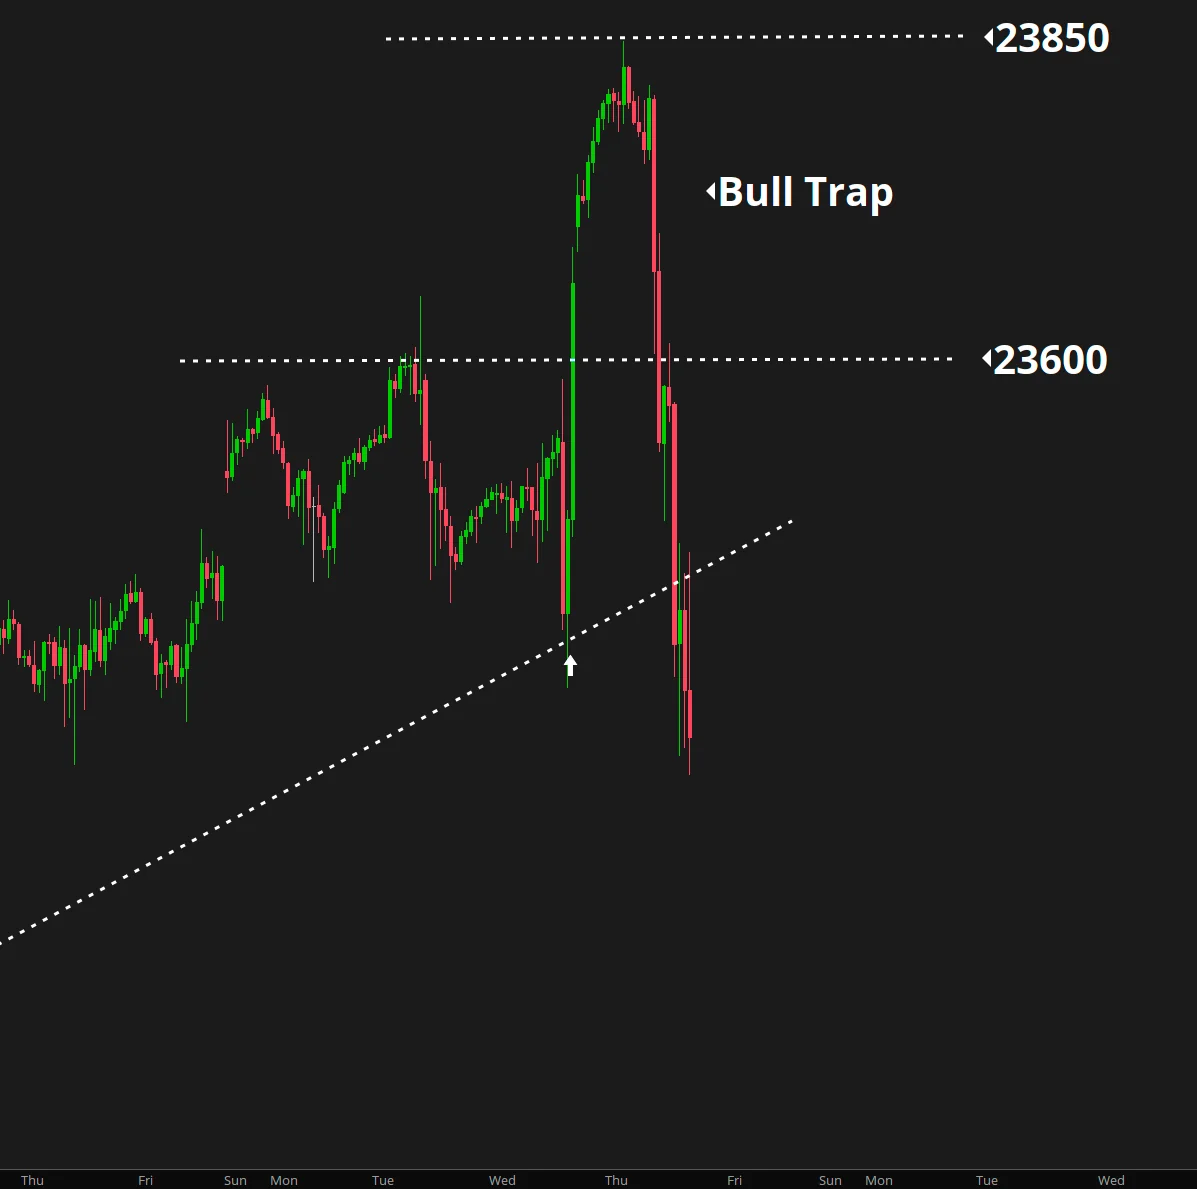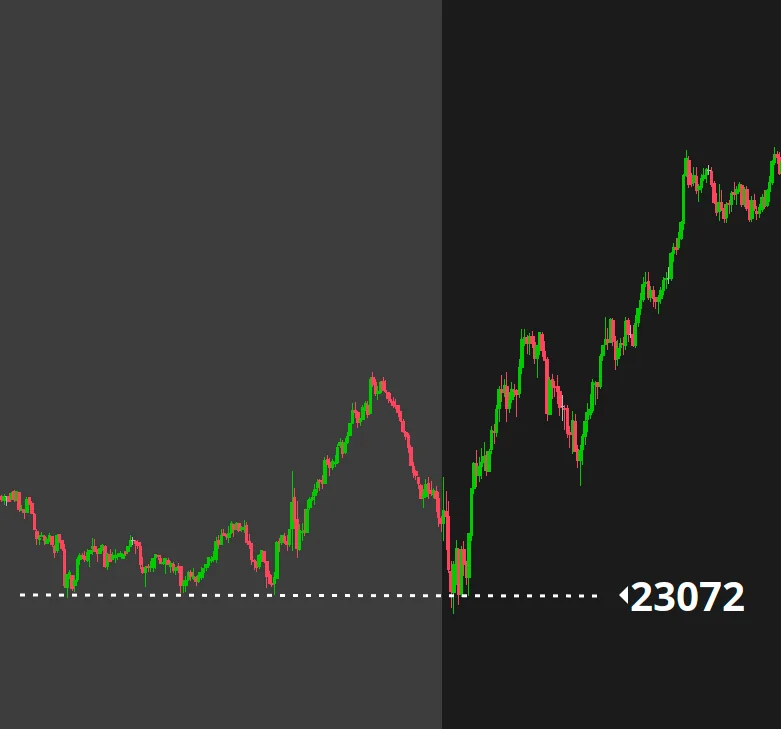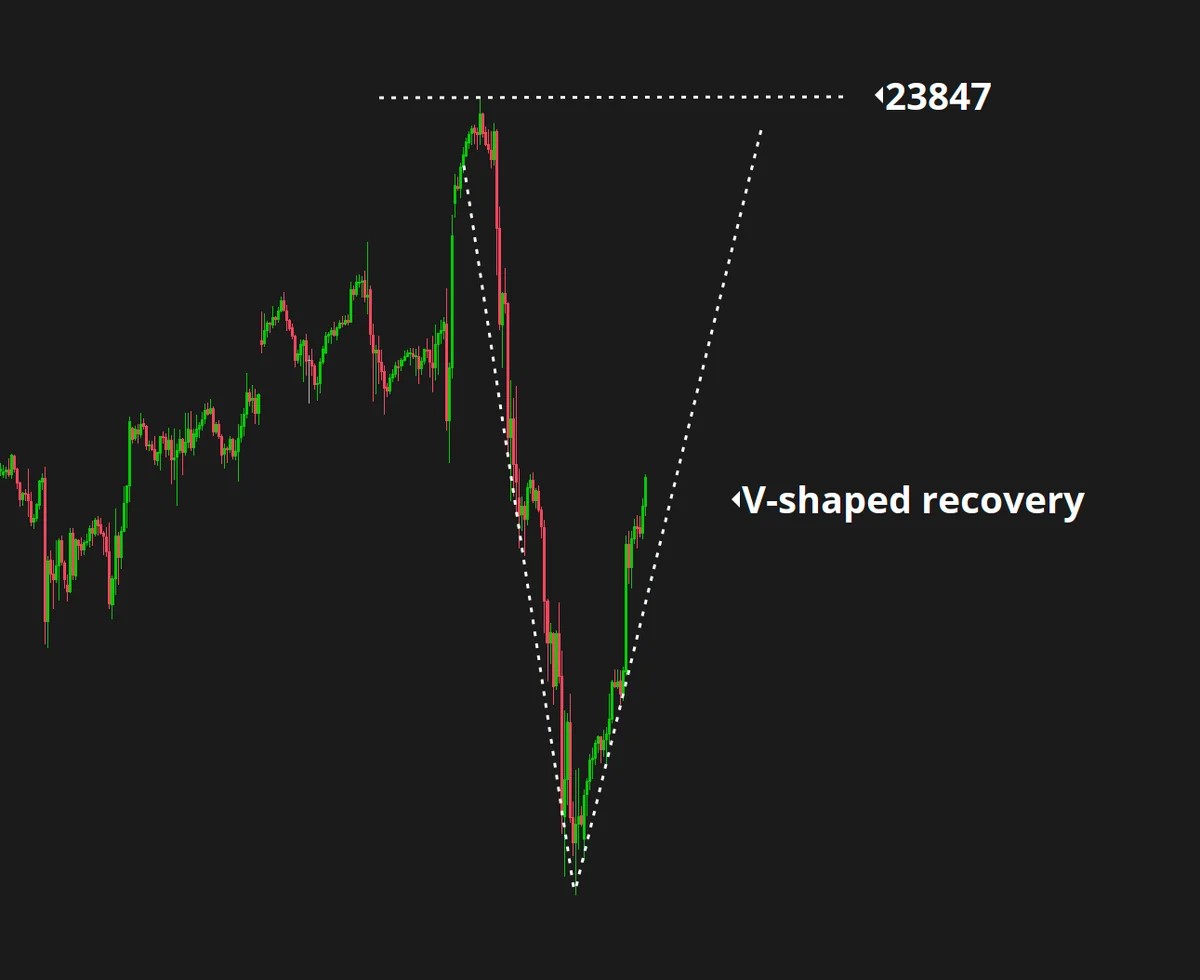
V-Shaped Recovery in NQ Sets Up All-Time High Test at 23,847
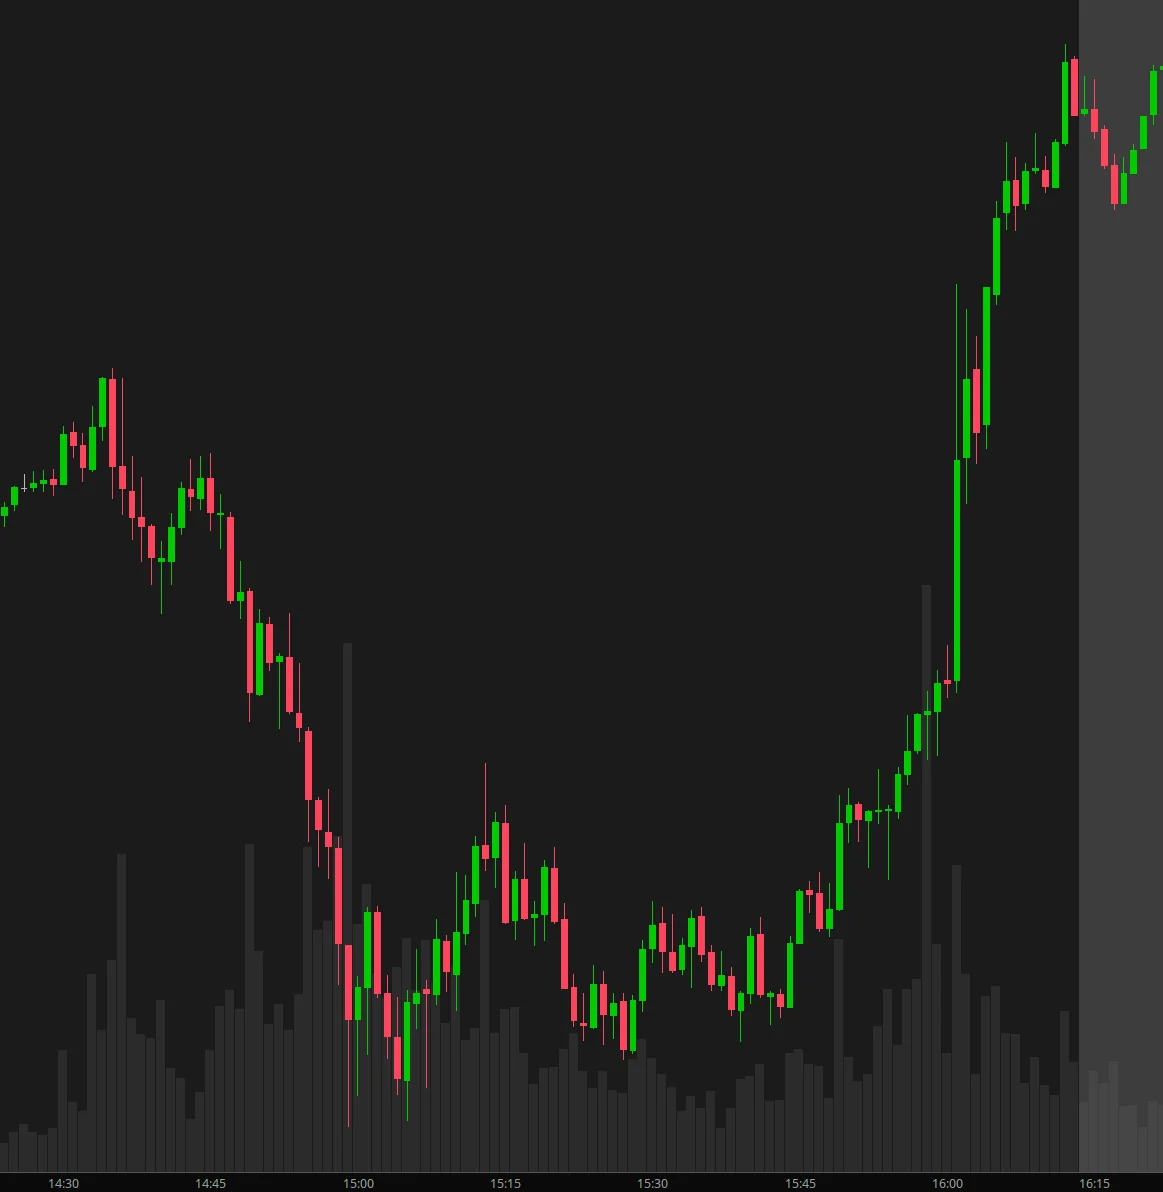
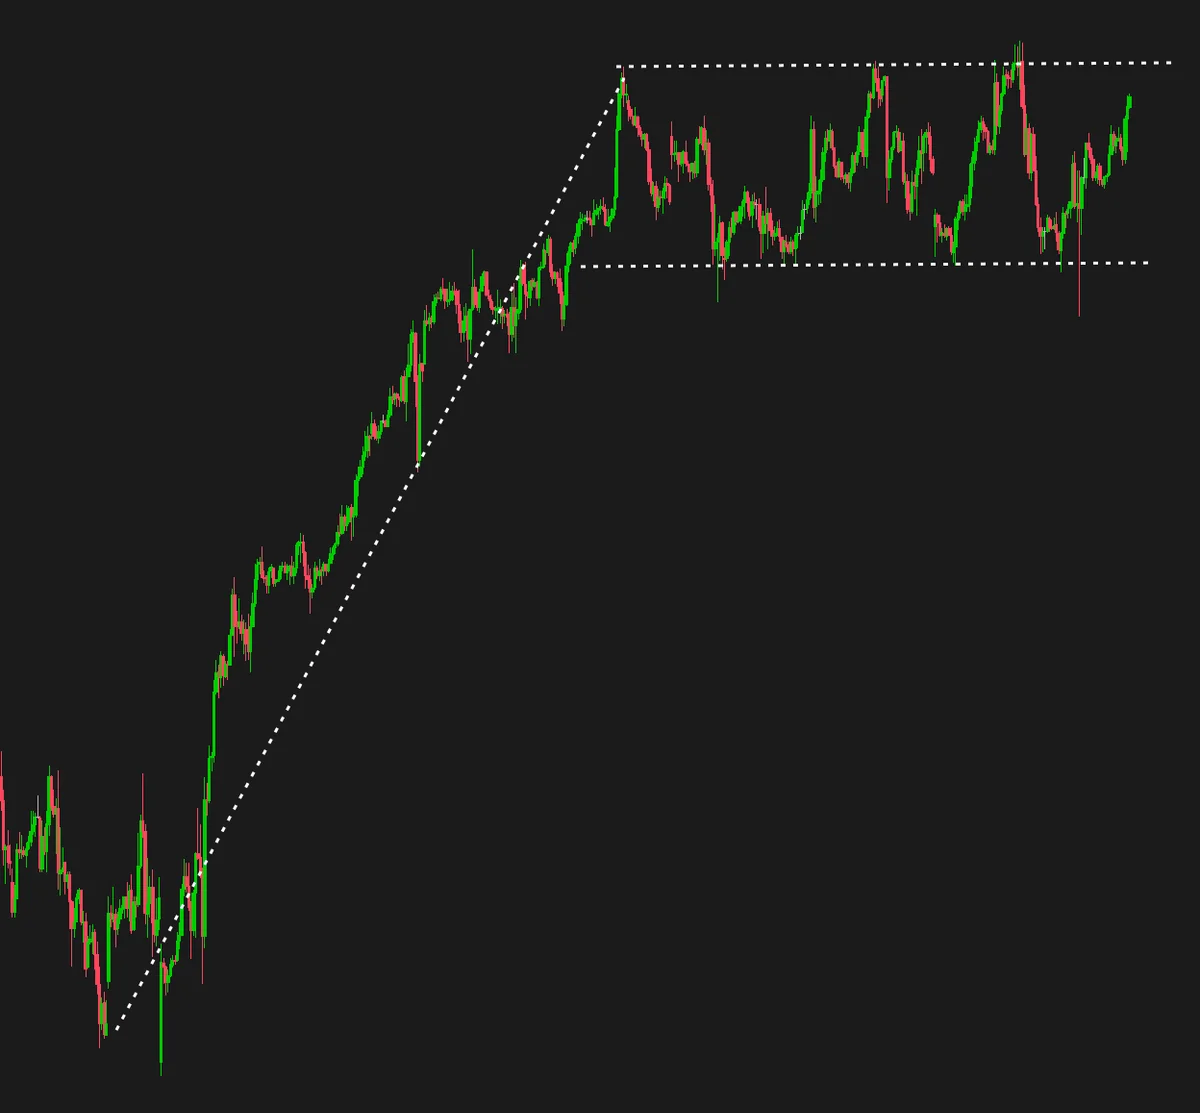
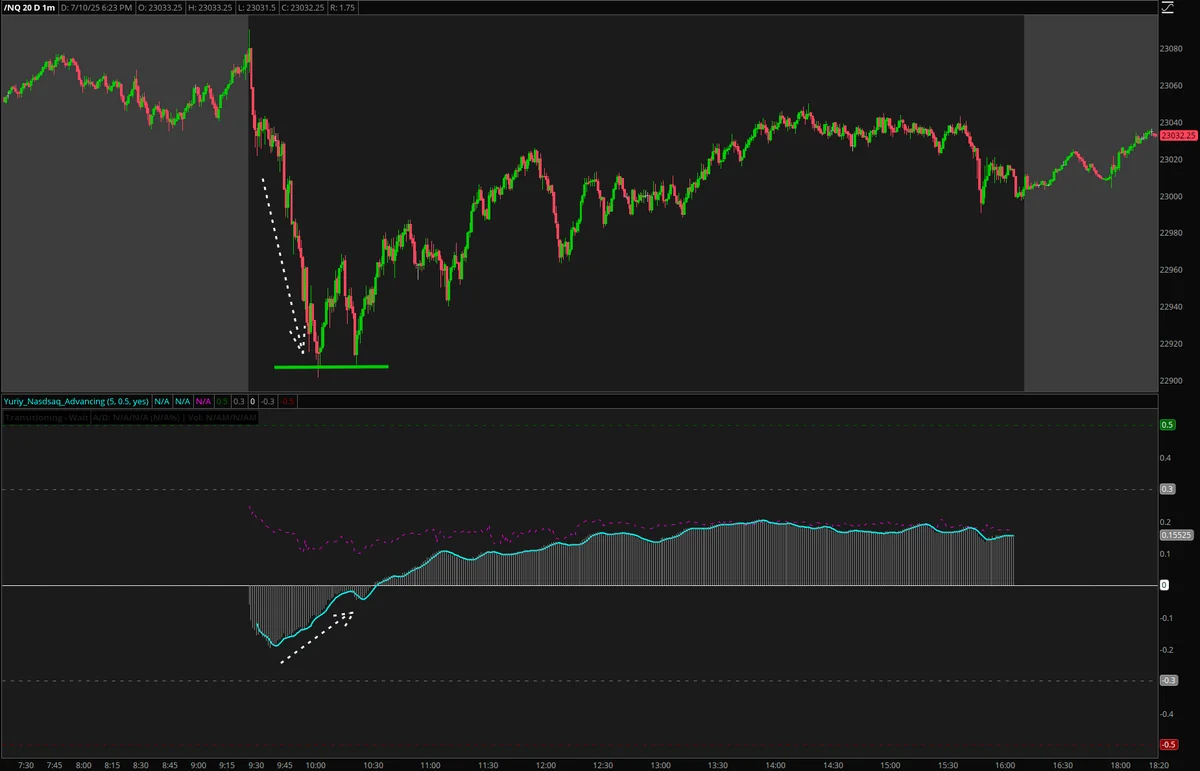
When NQ hit 22,800 support, sellers thought they had control - but Monday's Opening Rip changed everything. Now we're staring at a V-shaped recovery targeting all-time highs.
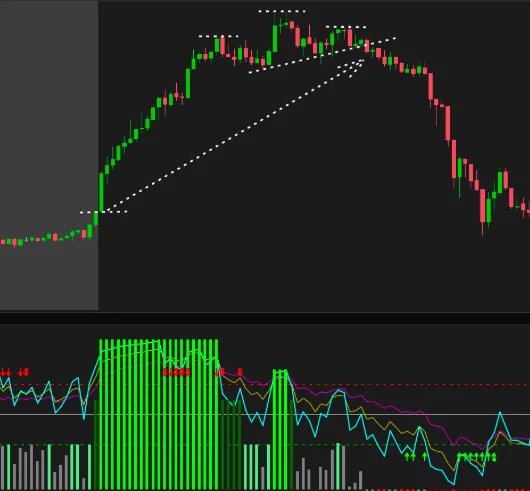
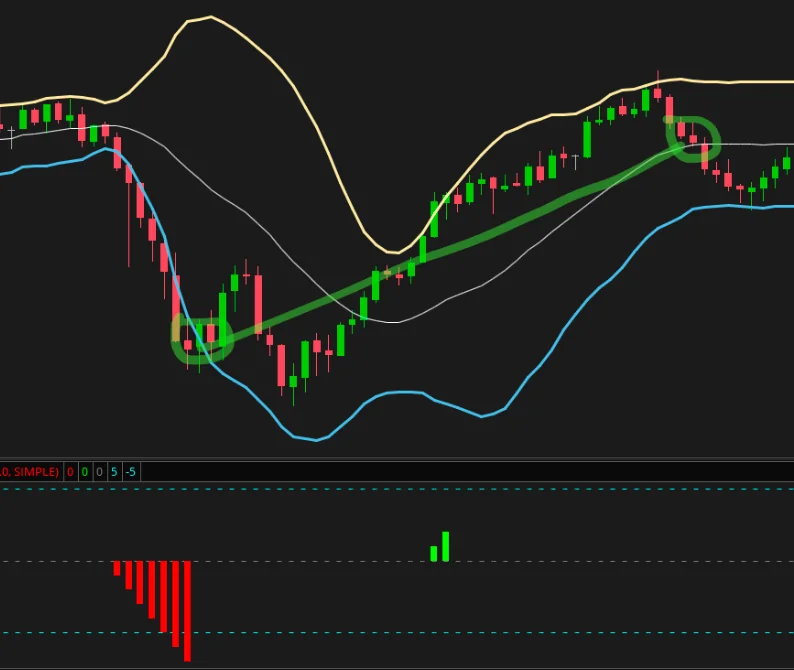
Indicators:Triple Rsi Momentum