NASDAQ Advancing-Declining Issues & Volume
Overview
This NASDAQ Advancing-Declining Issues & Volume indicator measures the overall health and participation of the NASDAQ market by tracking how many stocks are going up versus down, combined with volume flow analysis. Think of it like taking the market's temperature - instead of just looking at whether the NASDAQ index is up or down, it shows whether the majority of individual stocks are participating in the move with genuine buying or selling pressure.

Key Features
Discover what makes this indicator powerful for your trading
A/D Ratio Analysis
Compares advancing stocks to declining stocks on a -1 to +1 scale with visual histogram display showing real-time market participation strength.
Volume Flow Tracking
Shows whether more volume is flowing into rising or falling stocks, providing insight into institutional money movement and smart money direction.
Breadth Thrust Measurement
Displays the percentage of stocks that are advancing with extreme reading alerts when over 80% of stocks move in one direction.
Divergence Detection System
Automatically identifies when price moves opposite to breadth direction, often predicting major reversals before they become obvious to most traders.
McClellan Oscillator Integration
Incorporates momentum analysis to detect acceleration and deceleration in market breadth, helping time entries and exits with precision.
Smart Action Signals
Provides clear 'Buy Dips' and 'Sell Rips' signals based on extreme breadth conditions, removing guesswork from market timing decisions.
Applications
Real-world trading scenarios where this indicator excels
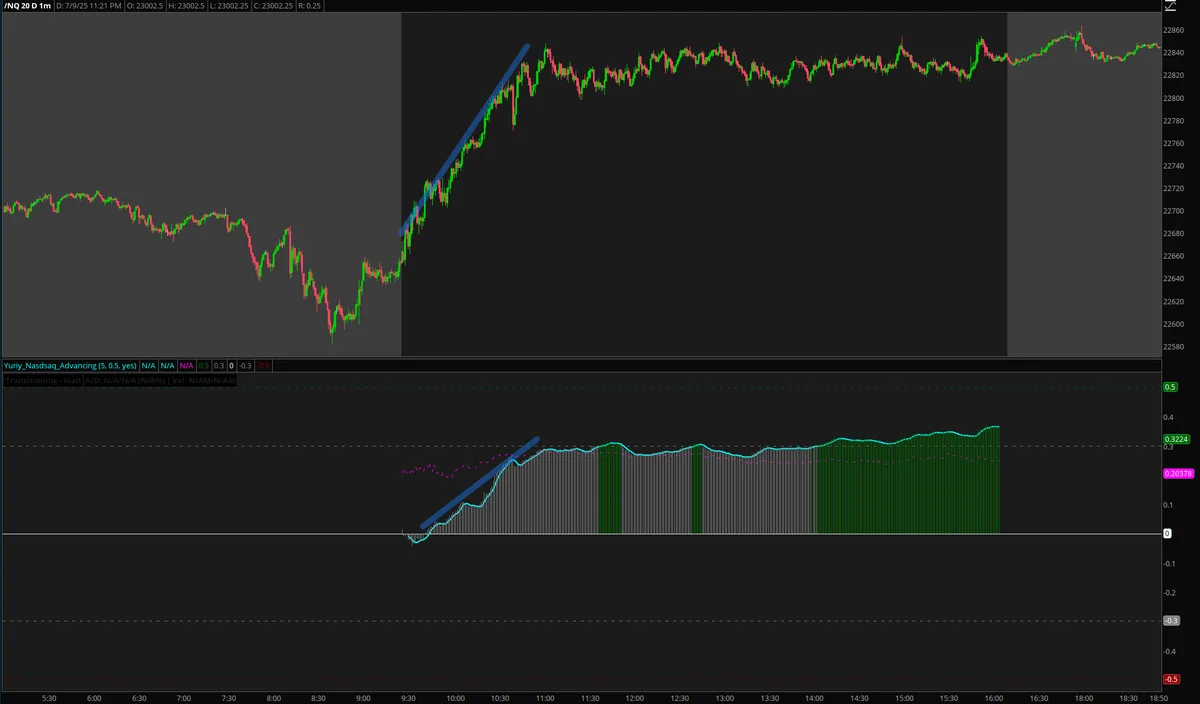
Buy the Dip Strategy
The NASDAQ Advancing-Declining Issues & Volume indicator excels at identifying high-probability dip-buying opportunities when market breadth shows extreme bullish readings above 0.5 with accelerating momentum. When most NASDAQ stocks are participating in the upward move, it signals sustained institutional buying pressure that supports continued price advancement, making pullbacks excellent entry opportunities.
Buy the Dip Application - Extreme Bullish Breadth
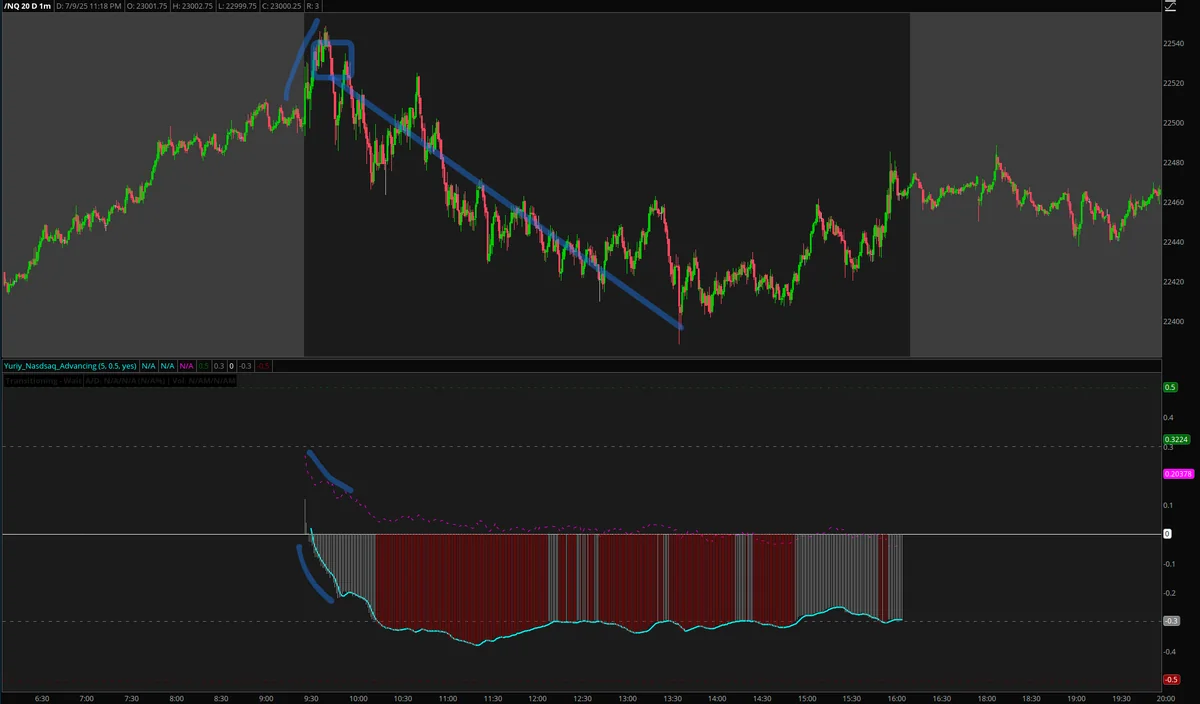
Divergence Detection
The indicator's most powerful feature is its ability to detect when price moves opposite to market breadth direction. When NQ makes new highs but breadth fails to confirm (showing declining participation), it provides early warning signals for potential reversals. These divergences often precede major market turning points by several bars, giving traders a significant edge.
Divergence Detection - Early Reversal Warning
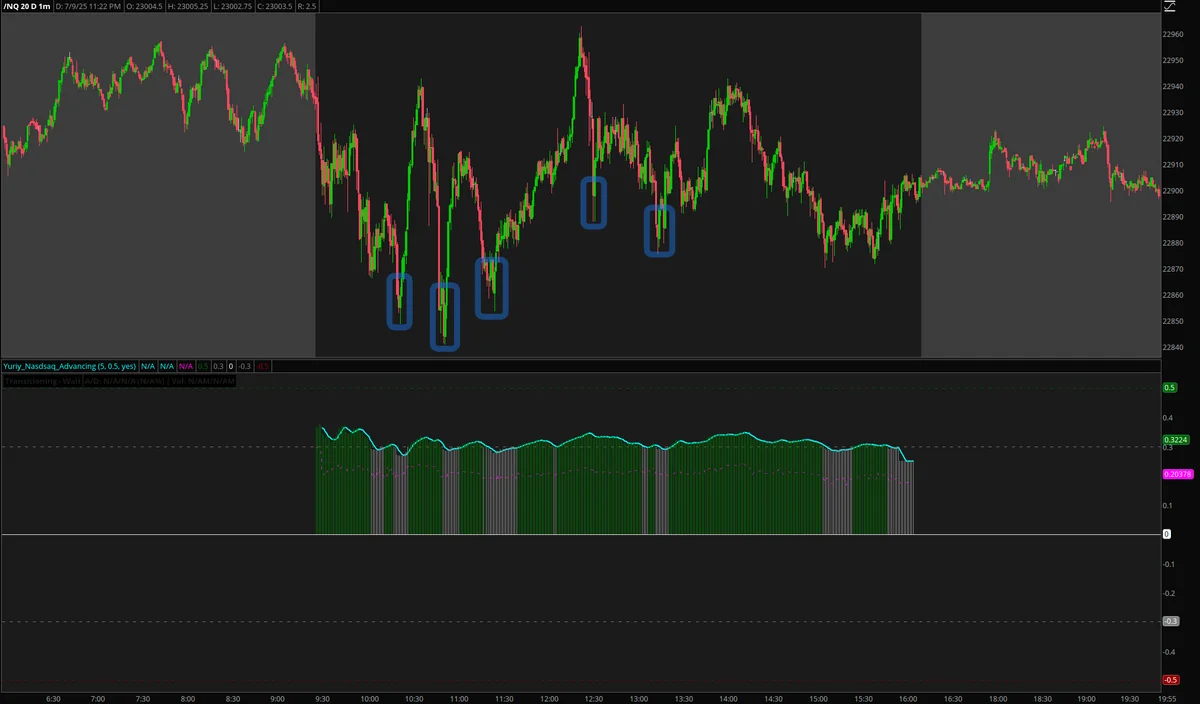
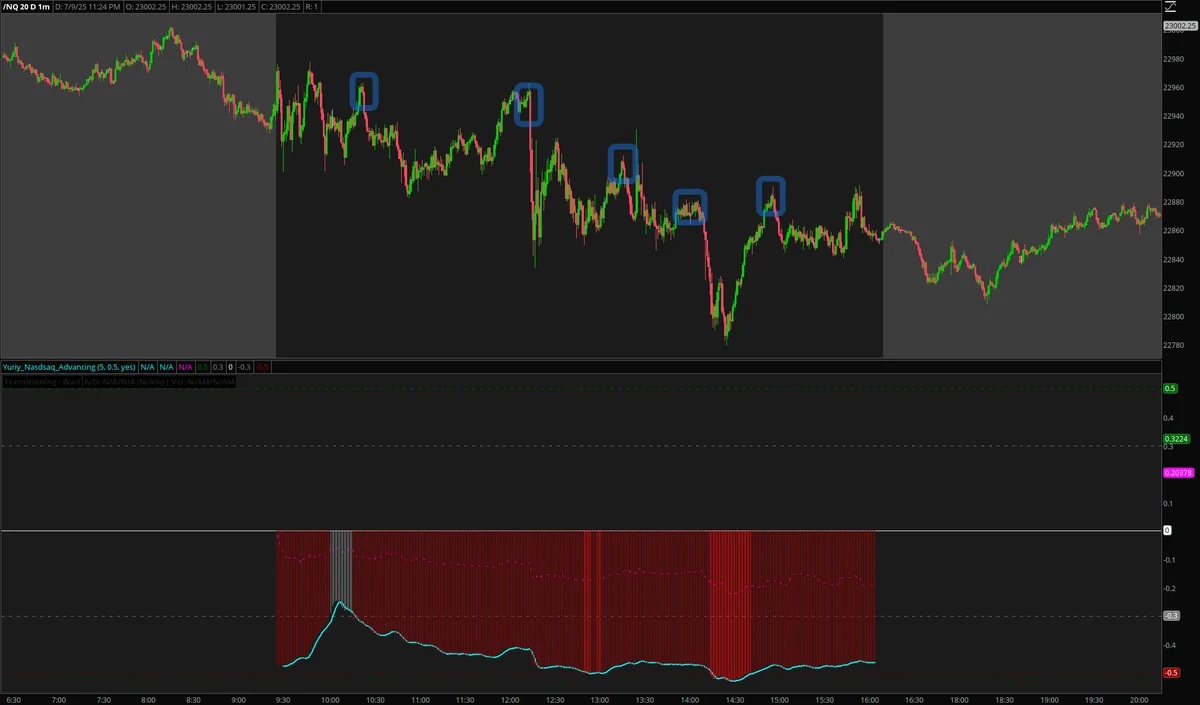
Sell the Rip Strategy
When breadth shows extreme bearish readings below -0.5 with deteriorating momentum, the indicator signals high-probability opportunities to sell rallies or initiate short positions. This occurs when the majority of NASDAQ stocks are declining despite any short-term price bounces, indicating underlying institutional selling pressure that will likely push prices lower.
Sell the Rip Application - Extreme Bearish Breadth
Trend Confirmation
Use the NASDAQ Advancing-Declining Issues & Volume indicator to validate the quality and sustainability of trending moves. Strong trends supported by broad market participation (many stocks moving in the same direction) are more reliable and likely to continue than moves driven by just a few large stocks. The breadth confirmation helps distinguish between high-quality trends worth riding and weak moves to avoid.
Trend Confirmation - Quality Move Validation
Download ThinkorSwim Code
NASDAQ Advancing-Declining Issues & Volume
Get the complete ThinkScript code for this indicator
Download ThinkScript CodeDownloads as: nasdaq-advancing-declining-issues-volume.txt
This indicator is completely free for the trading community.
Installation: Download the code file, open ThinkorSwim, go to Studies → Create Study → thinkScript Editor, paste the code, and save.
Support: If you need help with installation, email us at info@daytraderplaybook.com