Triple RSI Momentum - Stay in Strong Trends
Overview
The Triple RSI Momentum indicator combines fast (5), medium (11), and slow (24) RSI timeframes to create a sophisticated momentum analysis system. This indicator helps you stay in strong trends longer while avoiding choppy, sideways markets that can whipsaw your positions.

Key Features
Discover what makes this indicator powerful for your trading
Multi-Timeframe RSI Analysis
Combines three RSI periods for comprehensive momentum view, reducing false signals common with single RSI indicators
Momentum Persistence Tracking
Tracks how long strong momentum has been sustained, helping you stay in winning trades longer
Trend Hold Conditions
Smart logic that keeps you in positions during strong momentum phases above 65 or below 35 levels
Exit Warning System
Clear signals when momentum truly breaks, not just temporary pullbacks within strong trends
Divergence Detection
Identifies both regular and hidden divergences across all three RSI timeframes for high-probability setups
Visual Momentum Histogram
Color-coded histogram showing momentum strength from -100 to +100 with persistence factors
Applications
Real-world trading scenarios where this indicator excels
Trend Riding Strategy
The Triple RSI Momentum indicator excels at keeping you in strong trending moves. When all three RSI timeframes align above 65 or below 35, the indicator signals 'STRONG TREND HOLDING' and displays the persistence count. This helps you resist the temptation to exit during normal pullbacks within strong trends.
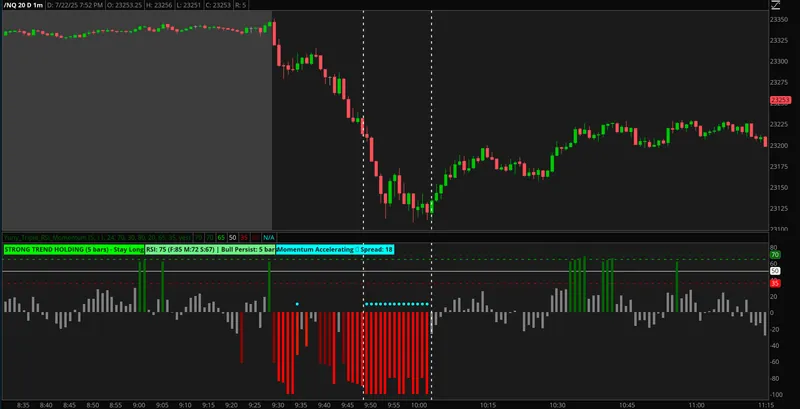
Strong trend holding signal keeps trader in position during 5-bar bull persistence phase with momentum accelerating
Avoiding Choppy Markets
One of the biggest challenges in day trading is avoiding choppy, sideways markets that can whipsaw your positions. The Triple RSI Momentum indicator helps identify these conditions when the RSI values are spread out and there's no clear momentum alignment across the three timeframes.
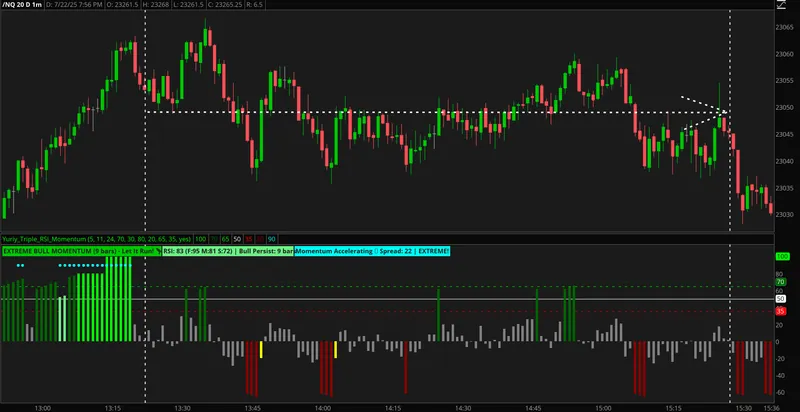
Indicator shows extreme bull momentum early in session, then helps identify when momentum fades and markets become choppy
Divergence Detection
The indicator automatically detects both regular and hidden divergences across all three RSI timeframes. Regular divergences signal potential reversals, while hidden divergences indicate trend continuation opportunities. The multi-timeframe approach reduces false divergence signals common with single RSI analysis.
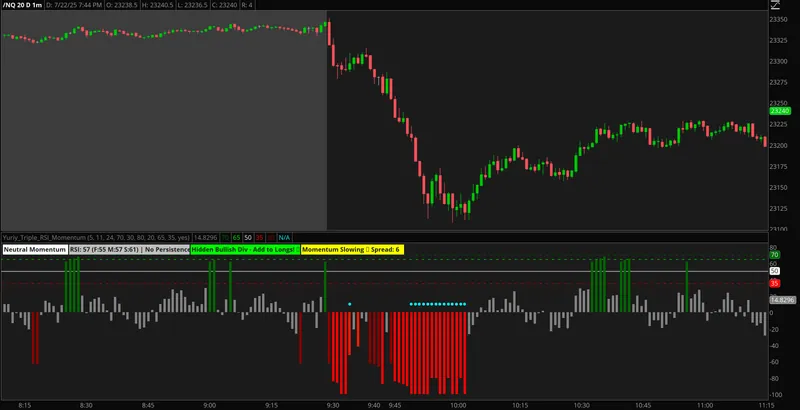
Hidden bullish divergence detected during trend continuation, providing 'Add to Longs' signal for position building
Download ThinkorSwim Code
Triple RSI Momentum - Stay in Strong Trends
Get the complete ThinkScript code for this indicator
Download ThinkScript CodeDownloads as: triple-rsi-momentum.txt
This indicator is completely free for the trading community.
Installation: Download the code file, open ThinkorSwim, go to Studies → Create Study → thinkScript Editor, paste the code, and save.
Support: If you need help with installation, email us at info@daytraderplaybook.com