Triple AO Wave Rider
Overview
The Triple AO Wave Rider combines three different Awesome Oscillator timeframes into a unified momentum system that helps traders ride trends and identify wave exhaustion points. This indicator provides clear visual signals for wave strength, acceleration, and potential reversal zones.

Key Features
Discover what makes this indicator powerful for your trading
Triple Timeframe Analysis
Combines fast (3/21), medium (5/34), and slow (8/55) AO calculations for comprehensive momentum view
Wave Strength Scoring
Unified wave score from -100 to +100 with dynamic weighting based on trend strength
Exhaustion Detection
Identifies when momentum waves are overextended and likely to reverse
Structure Analysis
Shows when all timeframes are aligned vs mixed for clear trend confirmation
Reversal Signals
Automatic detection of bullish and bearish reversal patterns with visual arrows
Divergence Warnings
Alerts when fast and slow timeframes show conflicting momentum signals
Applications
Real-world trading scenarios where this indicator excels
Wave Momentum Detection
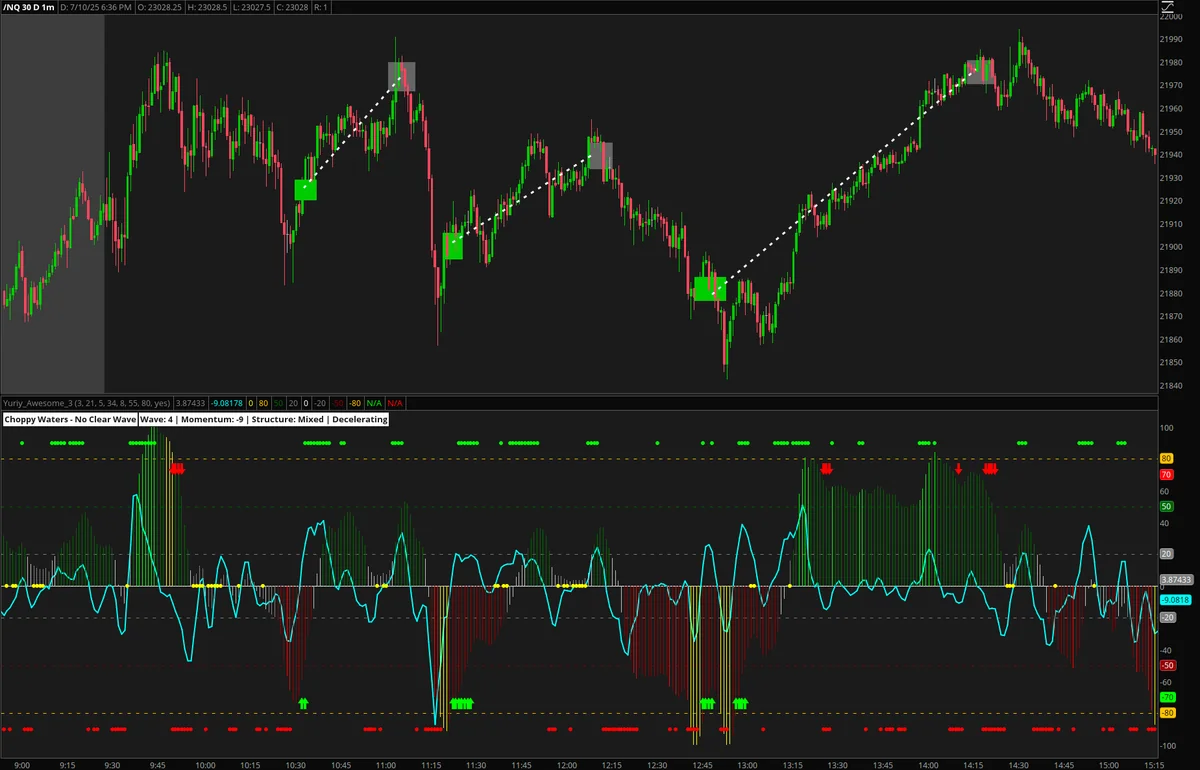
The indicator excels at showing when momentum is building or fading across multiple timeframes. The wave score ranges from -100 to +100, with dynamic color coding that instantly reveals wave strength. Green histogram bars show strong upward momentum with all timeframes aligned, while red bars indicate strong downward momentum. Yellow bars warn of wave exhaustion when momentum may be overextended.
Triple AO Wave Rider displaying wave strength with histogram colors and momentum line acceleration signals
Buying Dips in Uptrends
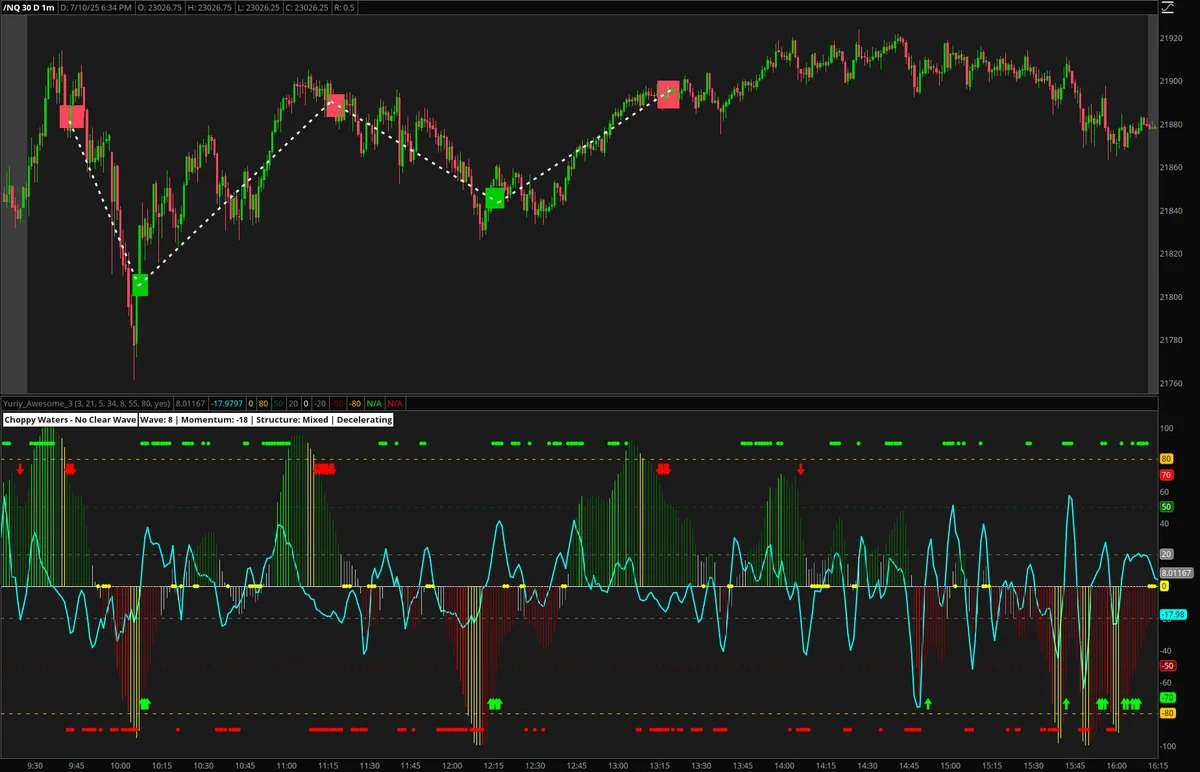
When the wave score is positive but pulls back toward the 20 level, this often represents a dip-buying opportunity in an ongoing uptrend. The key is watching for the wave structure to remain aligned (green dots) while the momentum line shows deceleration is ending. Look for wave scores above 20 but declining from higher levels, with structure dots remaining green and momentum line bottoming out.
Using wave score pullbacks and structure alignment to identify high-probability dip-buying opportunities
Shorting Rips in Downtrends
In downtrends, the indicator helps identify when rallies are just temporary 'rips' rather than genuine reversals. When the wave score is negative but bounces toward the -20 level, this often presents shorting opportunities. Key signals include wave scores below -20 bouncing from lower levels, structure dots remaining red, and momentum line peaks starting to decline again.
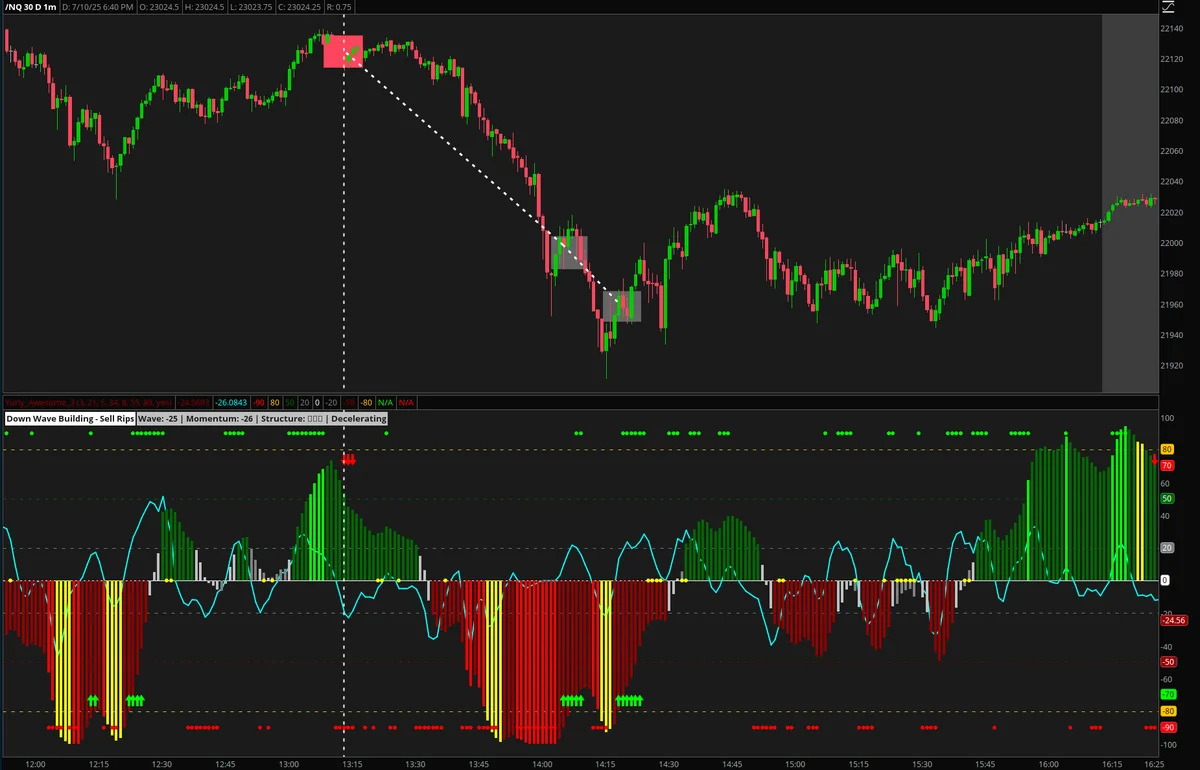
Identifying short-selling opportunities during downtrend rallies using wave score bounces and momentum line peaks
Reversal Pattern Recognition
The Triple AO Wave Rider automatically detects potential reversal patterns by analyzing extreme readings combined with momentum shifts. Bullish reversal signals occur when wave scores are below -40 with momentum rising above 10 and fast timeframe turning green. Bearish reversal signals appear when wave scores exceed 40 with momentum falling below -10 and fast timeframe turning red.
Automatic reversal signal detection with arrows marking high-probability turning points based on wave exhaustion
Download ThinkorSwim Code
Triple AO Wave Rider
Get the complete ThinkScript code for this indicator
Download ThinkScript CodeDownloads as: triple-ao-wave-rider.txt
This indicator is completely free for the trading community.
Installation: Download the code file, open ThinkorSwim, go to Studies → Create Study → thinkScript Editor, paste the code, and save.
Support: If you need help with installation, email us at info@daytraderplaybook.com