Setup Example
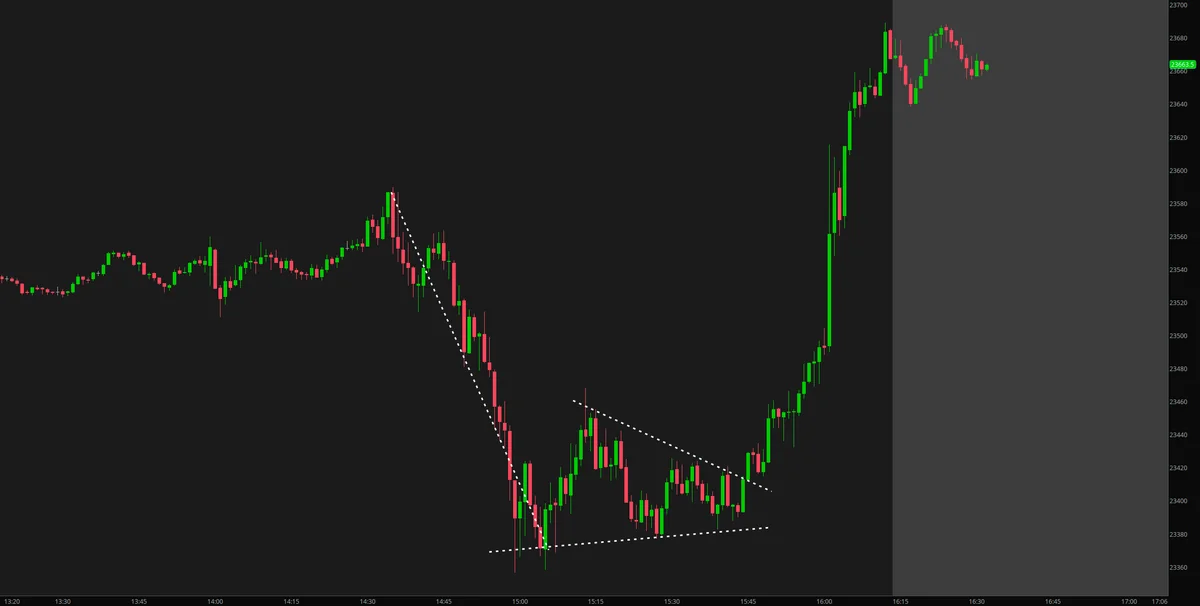
Setup Recognition
Primary Pattern Elements
The Failed Breakdown consists of four distinct phases that must occur in sequence:
- Initial Sharp Decline: A pronounced drop that appears to signal the start of a bearish move
- Failed Rally Attempt: Price bounces but cannot sustain upward momentum, creating uncertainty
- Higher Low Formation: The critical element - price refuses to break below the initial low
- Consolidation Phase: Sideways price action that builds energy for the eventual breakout
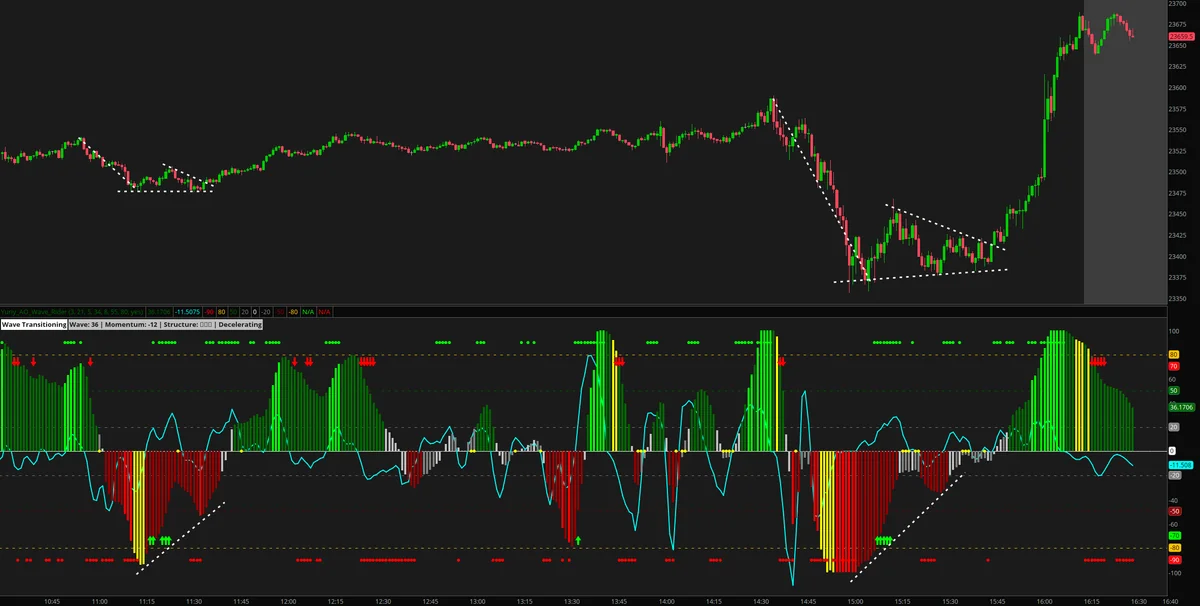
Triple AO Wave Rider Confirmation
The Triple AO Wave Rider indicator provides crucial confirmation through bullish divergence:
- While price makes the failed breakdown attempt (appearing bearish), the indicator forms higher lows
- This divergence signals underlying buying pressure despite the negative price action
- The three-wave system of the indicator helps identify when momentum is shifting from bearish to bullish
- Look for the indicator to turn positive or show buy signals as the consolidation phase develops
Key Differences from Falling Wedge
While similar to a falling wedge, the Failed Breakdown has distinctive characteristics:
- Consolidation period: Extended sideways movement rather than continuous wedge tightening
- Clear higher low: More obvious failure to break the initial low
- Horizontal resistance: Top of consolidation often forms a clear resistance line
- Spring action: The eventual breakout often happens more explosively
Entry Strategy
Optimal Entry Points
Two primary entry strategies offer different risk/reward profiles:
Conservative Entry
- Wait for price to break above the consolidation zone
- Enter on the first pullback after breakout
- Lower risk but may miss initial momentum
Aggressive Entry
- Enter during the consolidation phase once higher low is confirmed
- Place orders near the bottom of the consolidation range
- Higher risk but better reward potential
Confirmation Signals
- Triple AO Wave Rider Divergence: The indicator forms a bullish divergence during the pattern, with the oscillator making higher lows while price makes the failed breakdown attempt
- Volume patterns: Declining volume during consolidation, expanding on breakout
- Time factor: Consolidation typically lasts 10-20 bars
- Support hold: Multiple tests of the higher low level without breaking
Trading Psychology
Why This Pattern Works
The Failed Breakdown exploits several psychological factors:
- Bear Trap Effect: Short sellers entered on the initial decline get trapped when price won’t go lower
- Exhausted Sellers: The failure to break lower indicates selling pressure is depleted
- Accumulation Phase: The consolidation allows smart money to accumulate positions
- Short Covering Rally: Trapped shorts fuel the eventual breakout move
Key Success Factors
| Factor | Description |
|---|---|
| Higher Low Identification | Correctly identifying that the second low is higher than the first, confirming the failure of the breakdown |
| Patience During Consolidation | Waiting through the sideways action without exiting prematurely or entering too early |
| Triple AO Divergence | Identifying the bullish divergence where the indicator makes higher lows while price attempts to break down |
| Volume Analysis | Recognizing declining volume during consolidation and increasing volume on breakout |
| Risk Management | Placing stops below the higher low to protect against pattern failure |
| Breakout Confirmation | Waiting for clear price action above consolidation before adding to positions |
| Market Context | Understanding that this pattern works best in trending markets where dips are bought |
The Failed Breakdown setup provides traders with a high-probability entry opportunity by capitalizing on the failure of bearish momentum and the subsequent reversal dynamics, offering excellent risk/reward when properly identified and executed.
Historical Precedents
Below are 1 historical examples of this setup occurring in NQ futures. Each example shows the setup formation and execution.