Setup Example
Setup Recognition
Pre-Market Gap Analysis
The Gap and Down setup begins with identifying the right type of gap:
Qualifying Gap Characteristics:
- Gap size: NQ must gap up 1% or more (typically 200+ points)
- Catalyst driven: Strong tech earnings, Fed policy, or major economic news
- Time factor: Gap occurs during premarket hours (4:00 AM - 9:30 AM ET)
- Initial strength: Early premarket shows continued buying
Critical Pre-Market Pattern
After the initial gap up, watch for these bearish warning signs:
- Lower highs formation: Each rally attempt makes a lower peak
- Decreasing volume: Buying interest wanes on each bounce
- Time decay: Inability to push higher as 9:30 AM approaches
- Resistance rejection: Clear rejection at key technical levels
Market Open Reversal
Immediate Market Open Confirmation
The setup activates when these conditions align at market open:
Price Action Signals:
- Aggressive selling: Large red candles within first 2-3 minutes
- Volume surge: 2-3x average opening volume on selling
- No bounce: Price doesn’t recover or create lower highs
- Momentum continuation: Each 5-minute bar shows lower lows
Cumulative TICK Confirmation:
- Persistent negative readings: TICK stays below -500 consistently
- No positive spikes: Brief rallies show weak TICK readings
- Sustained selling: TICK remains negative throughout session
- Breadth deterioration: More stocks declining than advancing
Entry Strategies
Strategy 1: Immediate Short at Open
For aggressive traders who can act quickly:
- Short within first 2-3 minutes if all signals align
- Use the premarket high as initial resistance
- Add to position on any bounce attempts
- Highest reward but requires quick execution
Strategy 2: Short the Rips
For systematic traders who want confirmation:
- Wait for first bounce after initial drop
- Short when price fails at previous support turned resistance
- Use tighter stops above the bounce high
- More conservative but still captures significant moves
Position Management
Scaling Strategy:
- Start with partial position at open
- Add on 50% retracements of the initial drop
- Scale out at key support levels
- Trail stops below swing highs
Cumulative TICK Integration
Understanding TICK Signals
The Cumulative Nasdaq TICK is crucial for this setup:
Negative TICK Interpretation:
- -200 to -500: Mild selling pressure, watch for continuation
- -500 to -1000: Strong selling, high probability setup
- Below -1000: Extreme selling, excellent short opportunity
TICK Timing:
- First 30 minutes: TICK should stay predominantly negative
- Mid-morning: Sustained negative readings confirm trend
- Any positive spikes: Should be brief and weak
TICK-Based Exit Signals
Know when the setup is losing validity:
- Persistent positive TICK: Above +200 for extended periods
- TICK divergence: Price makes new lows but TICK improves
- Neutral TICK: Oscillating around zero suggests consolidation
Psychology Behind the Pattern
Why This Setup Works
The Gap and Down exploits several market dynamics:
Pre-Market Exhaustion:
- Early buyers become trapped as momentum fades
- Profit-taking begins before regular session opens
- Institutional algorithms detect weakening momentum
Opening Hour Dynamics:
- Retail traders chase the gap up at worst possible time
- Professional traders fade the move with size
- Options market makers hedge short gamma positions
Psychological Factors:
- FOMO reversal: Early excitement turns to panic
- Trap mentality: Buyers become sellers when pattern fails
- Momentum shift: Bearish sentiment builds throughout session
Common Entry Variations
The Immediate Fade
- Short right at 9:30 AM open
- Best for news-driven gaps that show immediate weakness
- Requires quick decision making and tight risk management
The Failed Bounce Short
- Wait for first bounce attempt to fail
- More conservative but still captures major part of move
- Better for beginners who need confirmation
The Support Break Short
- Short when price breaks below key premarket support
- Confirmation-based approach with defined risk
- Good for systematic traders
Risk Management Guidelines
Stop Loss Placement
- Initial stop: Above premarket high
- Adjusted stop: Above any significant bounce high
- Trailing stop: Below each swing high as trend develops
Position Sizing
- Account for volatility: Gaps create wider ranges
- Scale in gradually: Don’t use full size immediately
- Risk management: Never risk more than 2% of account
Key Success Factors
| Factor | Description |
|---|---|
| Gap Size Recognition | Identifying gaps of 1% or more in NQ futures, which provide sufficient catalyst-driven momentum for the reversal pattern |
| Premarket Pattern Analysis | Recognizing the lower highs formation during premarket hours that signals weakening bullish momentum despite the initial gap up |
| Opening Volume Confirmation | Confirming aggressive selling at 9:30 AM open with 2-3x average volume, validating the reversal momentum |
| Cumulative TICK Analysis | Using persistent negative TICK readings (below -500) throughout the session to confirm broad market selling pressure |
| Entry Timing Precision | Executing shorts at optimal moments - either immediately at open or on failed bounce attempts to maximize risk/reward |
| Bounce Failure Recognition | Identifying when rallies fail to reclaim significant levels, providing additional shorting opportunities throughout the session |
| Risk Management Discipline | Setting stops above premarket highs and adjusting position sizes for the increased volatility typical of gap scenarios |
Warning Signs to Avoid
Don’t trade this setup when:
- Gap is less than 0.5% (insufficient catalyst)
- Premarket continues making higher highs
- TICK shows positive readings at open
- Low volume on the initial selling
- Strong support level immediately below
The Gap and Down setup provides excellent risk/reward opportunities for traders who can quickly identify when premarket strength is actually weakness in disguise, using the Cumulative TICK as their key confirmation tool.
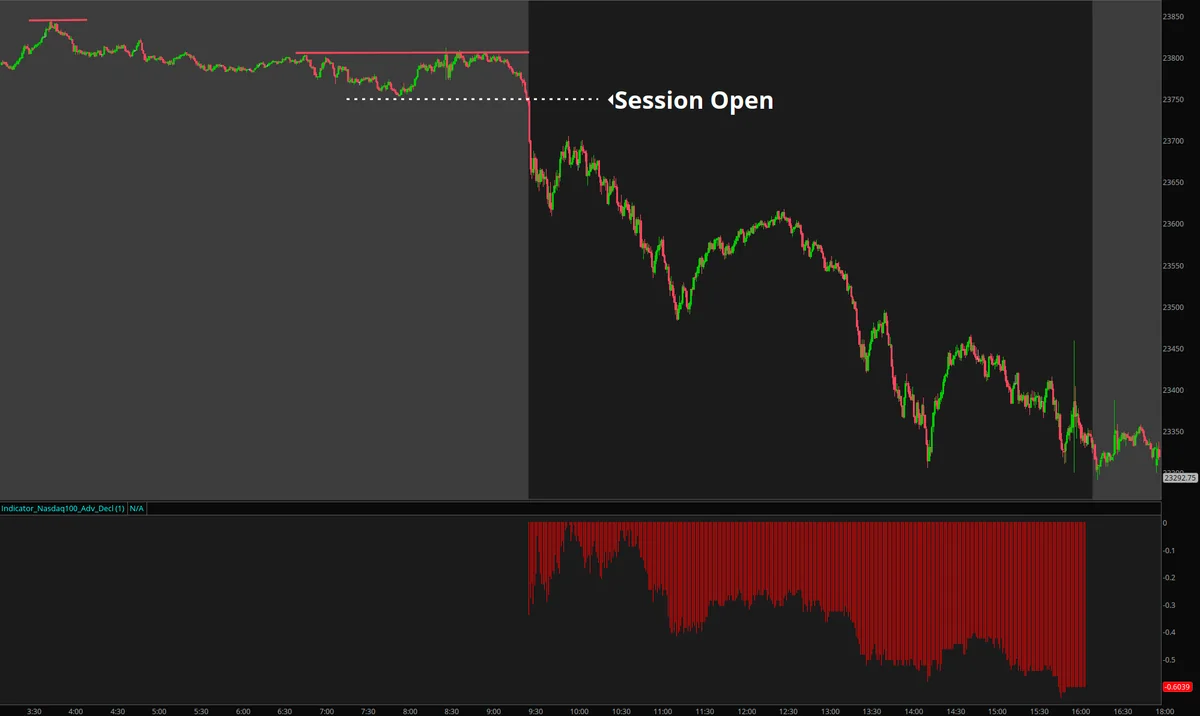
Historical Precedents
Below are 1 historical examples of this setup occurring in NQ futures. Each example shows the setup formation and execution.
