Setup Example
Key Setup Components
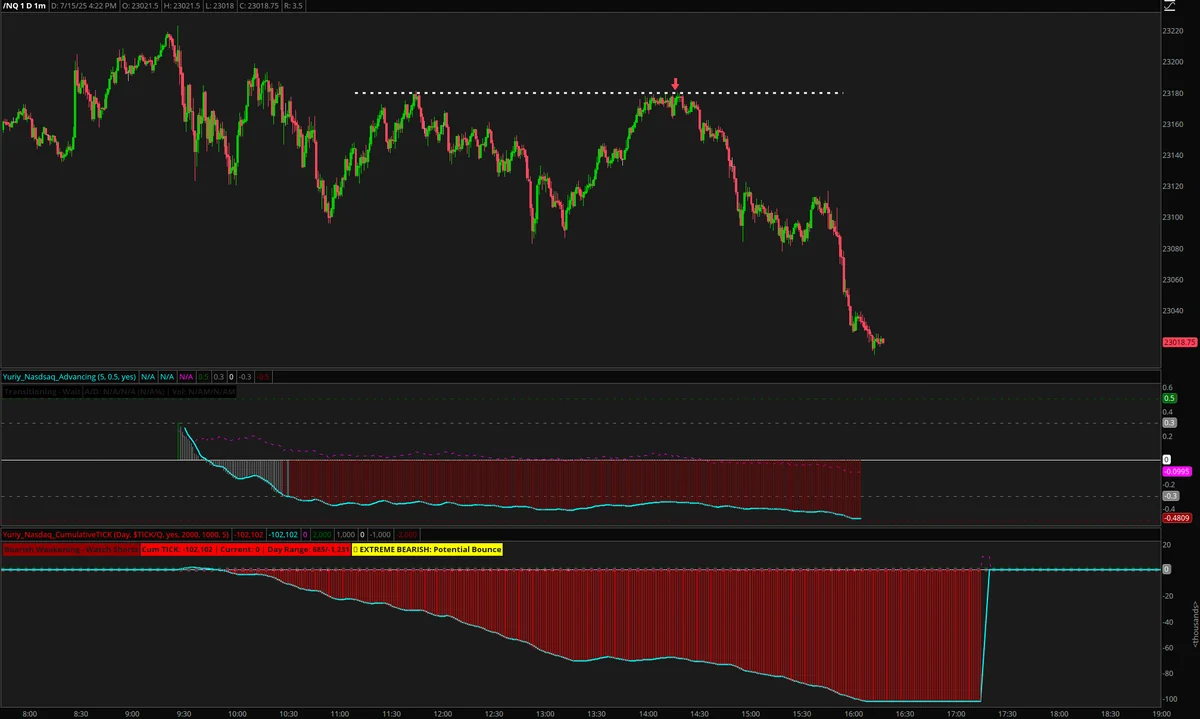
1. Prior Decline and Recovery
The setup begins with price experiencing a decline from higher levels, followed by a recovery attempt that brings price back to a significant resistance zone.
2. Resistance Level Identification
The resistance level should be clearly defined from previous price action - this could be:
- Previous swing highs
- Round numbers (psychological levels)
- Moving averages acting as dynamic resistance
- Gap levels from previous sessions
3. Failure to Break Through
Price shows clear signs of struggling at the resistance level:
- Multiple touches without breakthrough
- Weak bounce attempts
- Volume declining on rallies
- Price action becoming increasingly choppy
4. Market Breadth Deterioration
The critical confirmation comes from market internals:
- Advancing vs Declining Issues: More stocks declining than advancing
- Cumulative TICK: Consistently dropping, showing institutional selling
- Breadth Divergence: Price may hold but breadth is weakening
Execution Notes
This setup works best when all components align simultaneously. The combination of technical resistance and poor market internals creates a high-probability short opportunity as institutional money appears to be distributing at the resistance level.
The play is particularly effective in NQ futures due to the index’s sensitivity to market breadth and institutional flow, making it ideal for capturing these distribution patterns.
Historical Precedents
Below are 1 historical examples of this setup occurring in NQ futures. Each example shows the setup formation and execution.